'top' command Analyzer

Parses Unix/Linux/solaris/AIX/HP-UX 'top' command output & generates an insightful report containing intuitive metrics,beautiful graphs,and recommendations to optimize server performance

Hero Image

Top Command Output

Tip: Copy & paste top command output

WHAT WE DO

top Command Analysis

  • Understand top command

    Top command output contains several fields such as us%, sy%, ni%, Mem, Swap, VIRT, SHR,... All those fields are presented as brilliant graphs and easy to understand metrics.

  • Overlooked Metrics

    Analyzes various overlooked metrics in the top command output. If their values are breached or goes beyond industry thresholds,(Warning/Danger) alerts are reported.

  • Optimize Performance

    Several tips,tricks,and recommendations are given to optimize your server's performance based on analyzing the top command's output.

  • Helpful tips

    Top command output contains various fields like task types(RUNNING, ZOMBIE, SLEEPING,...), task/nice priorities, CPU percentages(id, wa, st, hi, si,...). All those fields are aggregated and presented with helpful tutorials,video clips right next to them.

What We Do
Speciality

SPECIALITY

Visualize top command output through our brilliant graphs & metrics. Optimize Server performance through our recommendations.

Top command output report several metrics about server's performance such as User CPU time, System CPU time, nice CPU time, Idle CPU time, Waiting CPU time, Hardware Interrupt CPU time, Software Interrupt CPU time, stolen CPU time,Memory usage,Swap usage, load average, uptime,processes running on the server, their priorities, CPU/Memory consumption, and several more information. 'top command analyzer',parses all those fields and generates a highly insightful report with graphs,metrics and recommendations

Features

Share, troubleshoot, analyze top command output easily

  • Icon Team Collaboration
    Team Collaboration

    You can copy and paste the top command analysis report URL in the email, support tickets. It makes it easy to collaborate over the report with other team members.

  • Icon Thread wise CPU,Mem
    Thread wise CPU,Mem

    'top -H -p {PID}' command reports CPU/Memory consumed by each thread within the process.It's useful for troubleshooting a particular process.Tool can analyze this output as well.

  • Icon All flavors of Unix
    All flavors of Unix

    Top command output varies slightly based on the OS. We parse UNIX,Linux(Red-hat,Debian,Fedora,SUSE),AIX,HP-UX,Solaris & all other flavors top command output.

  • Icon Root cause Analysis
    Root cause Analysis

    Parent product yCrash captures 360-degree data such as GC Logs,thread dumps, heapdumps, top, netstat, iostat, disk usage, ps,...analyzes them and generates instant RCA report.

  • Icon top command arguments
    top command arguments

    Various arguments can be passed to top command,such as -b,-c,-d,-H,-I,-n,-p,-s,-S,-u,-U,-w.Tool is capable of parsing all argument output to generated one unified report.

  • Icon Dashboard
    Dashboard

    Parent product 'yCrash' provides one powerful dashboard, where all product problems analysis report can be viewed, searched(by date, host, app), compared, and studied.

Features

HOW IT WORKS?

Simple steps to analyze 'top' command output

Step 1

Capture

Issue 'top' command on your server.

Step 2

Copy & Paste

Copy the 'top' command output and paste it in the above-given form. Submit the form.

Step 3

View Report

Top command output will be parsed, and the analysis result will be generated instantly.

Training course

Learn JVM Performance and Troubleshooting

Watch A Preview

Placeholder Image

Training course

Learn JVM Performance and Troubleshooting

  • Become a world class JVM performance expert
  • Troubleshoot production performance problems in a fraction of time

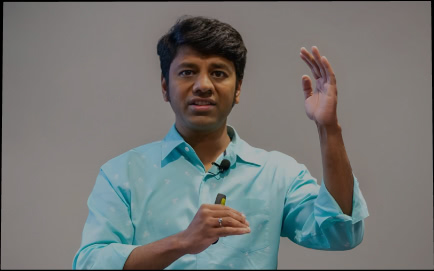
Instructor: Ram Lakshmanan, Architect of GCeasy

What's included:
  • 9 hours of video series with case studies and real life examples

  • 3 months yCrash tool subscription

  • e-books and study material to complete this course

  • LinkedIn shareable certificate

  • 1 year course subscription

Attended by engineers from all over the world from the premier brands

4.8 Stars Learner Rating

Cool Tools

Check Out Our Other Products

Ycrash

Ycrash

Automatically captures & analyzes GC Logs, thread dumps, heap dumps & several more artifacts to identify root cause.

Learn More
GCeasy

GCeasy

Universal Garbage collection log analysis tool. Tune and troubleshoot memory and GC problems.

Learn More
HeapHero

HeapHero

Easy to use Java, Android heap dump analyzer. Solve OutOfMemoryError, memory leaks in seconds.

Learn More
FastThread

FastThread

Machine learning algorithms aided tool to analyze the thread dumps, core dumps, and also hs_err_pid dumps.

Learn More
FastThread

BuggyApp

Simulates performance problems like Memory Leak, OutOfMemoryError, CPU spike, StackOverflowError etc.

Learn More

Want to try yCrash?

Try For free